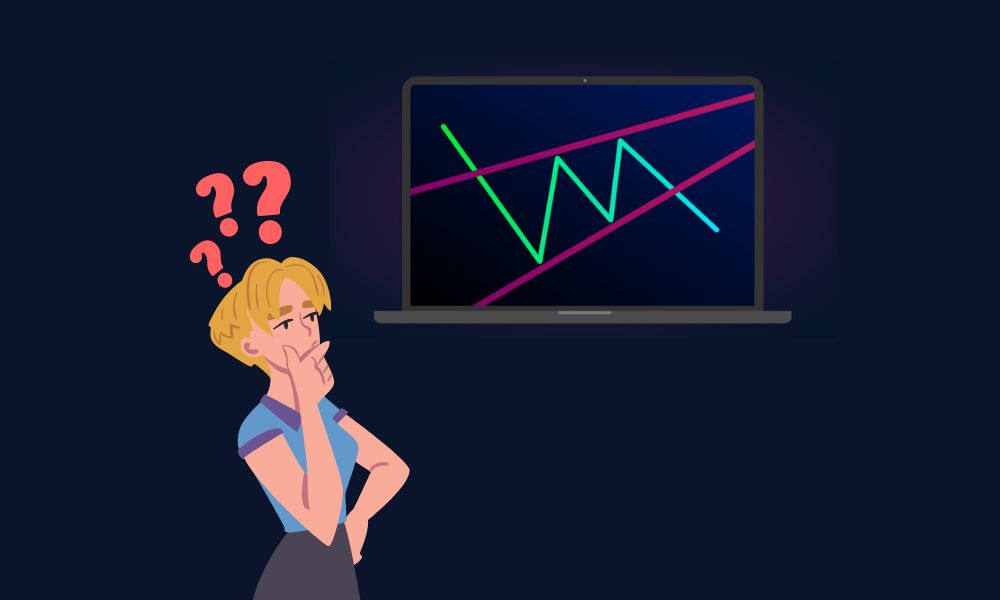
The RSI is a technical indicator used in technical analysis to determine price velocity.
Its values are calculated by dividing the total number of positive changes over a specific time period by the total number of negative changes.
Its values are calculated by dividing the total number of positive changes over a certain time period by the total number of negative changes.
This indicates that when the degree of price volatility grows, so do RSI levels. As a result of its design, RSI values range from 0 to 100.
Values greater than 75 indicate overbought conditions, while values less than 25 indicate oversold conditions.
Higher RSI levels (55-75) indicate a favorable trend. Lower values (25-45) indicate a downward trend.
The Stochastic RSI oscillator is a common oscillator in technical analysis. It is a range-bound oscillator that aids in determining price momentum.
The stochastic RSI is also quite good at detecting overbought or oversold levels, which indicate falling or rising momentum.
George Lane created a system that allowed him to compare the prices at the end of the day to a range of prices over a set period of time.
The Stochastic RSI depicts values ranging from 0 to 100. Values above 80 indicate that the market is overbought.
Values less than 20 indicate that the market is oversold. The stochastic RSI charts are made up of two lines. One of them provides actual oscillator readings for a certain session.
The three-day simple moving average is provided by the other. Lane believed that during uptrends, prices have a natural inclination to close around their highs and vice versa.
Because prices are thought to follow momentum, the intersection of the stochastic RSI's two charting lines indicates a significant shift in momentum.
As a result, the intersection also indicates that the current market trend is set to shift.
Although the Stochastic RSI and Relative Strength Index appear to be identical (especially since they both include RSI in their names), there are several differences between the two oscillators.
There are variances in both construction and use. The fundamental distinctions between stochastic RSI and RSI are as follows.
RSI, on the other hand, operates under the assumption that prices tend to deviate from a mean position before reacting or withdrawing.
At the same time, the RSI oscillator calculates its values using only the closing price of the most recent session.
The RSI assists technical traders in determining when a stock's price is moving too quickly.
Stochastic, on the other hand, aids in determining when a price goes to the highest or lowest point of a trading range.
When the market is flat or turbulent, the Stochastic RSI produces good results. That is, Stochastic outperforms in non-trending markets.
The reason for this is that Stochastic is an indicator on an indicator. It is a derivation of the RSI, which means it is also affected by the RSI.
As a result, it lags greatly because it is two steps removed from prices.
The Stochastic RSI version, on the other hand, was designed to be more sensitive and provide more signals.
This means that the Stochastic RSI creates more signals and causes more overbought/oversold circumstances.
The differences in the oscillators do not suggest that one is superior to the other. These are just changes in structure and application.
Both the stochastic RSI and the RSI are extremely popular oscillators. Their appeal stems from their utility.
They are both momentum oscillators that detect overbought or oversold market circumstances. They are both adept at determining price momentum.
However, in some market conditions, both oscillators perform better. In general, RSI performs better in a trending market, but stochastic performs best in flat or choppy markets.
While the relative strength index was created to evaluate the pace of price changes, the stochastic oscillator formula works best when the market trades in narrow ranges.
In general, RSI is better for markets that are moving in a specific direction, whereas stochastics are better for markets that aren't moving at all.
|
HOT TOPICS |
|
 |
|
 |
|
 |